

PMBI — Project Management Business Intelligence
Standardized Earned Value Management reporting for your entire capital portfolio, built and hosted on Microsoft Azure.
PMBI takes the data you already have and turns it into consistent, executive-ready dashboards — cost performance, schedule performance, budget variance, and more — refreshed every reporting period, without asking your team to change how they manage projects.
Problem
Solution
Reports are consistent, but they don’t reveal what’s actually happening.
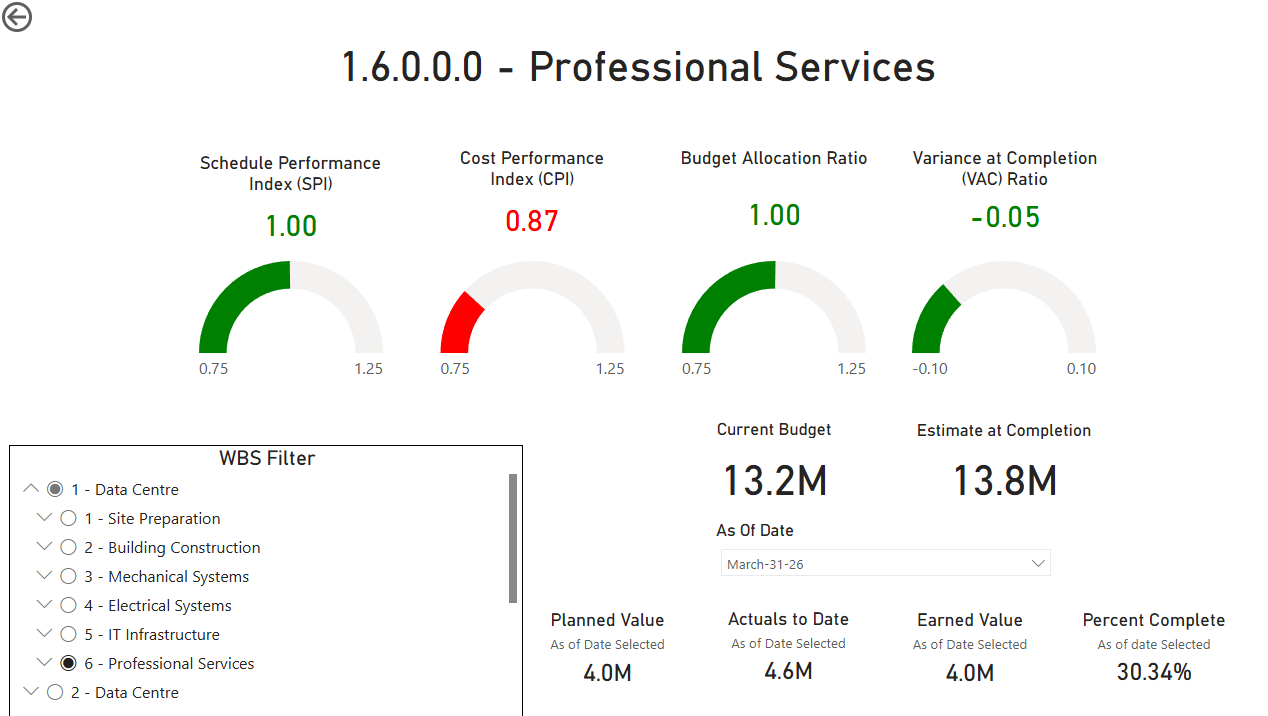
PMBI calculates SPI, CPI, and variance directly from your data using standardized EVM formulas — the same signal, calculated the same way, every period.
Getting from raw project data to a real dashboard usually means a consulting engagement.
PMBI needs six simple tables — WBS, Budget, Tasks, Planned Value, Actuals, Budget Adjustments — about 18 fields total. Most organizations already track this data somewhere.
Your team already has a project management system. You don’t want another one to learn.
PMBI doesn’t replace your PM tools. Keep managing projects the way you do today — PMBI turns your periodic data into reporting.
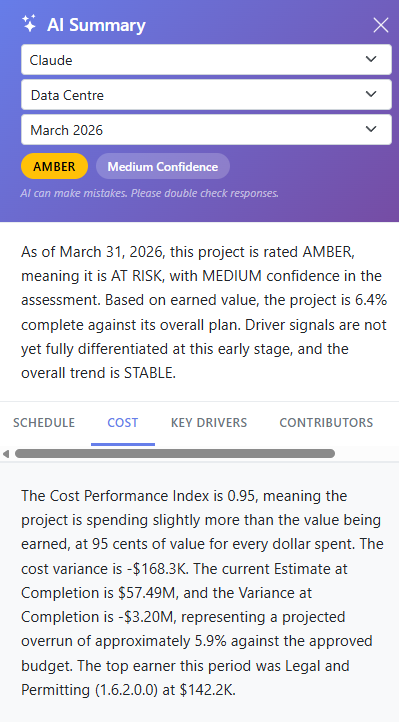
Executives want a plain-language read on project health, not a spreadsheet.
The AI Summary panel generates a written narrative of schedule, cost, and key risk drivers each period (select plans).
Getting from raw project data to a real dashboard usually means a consulting engagement.
PMBI needs six simple tables — WBS, Budget, Tasks, Planned Value, Actuals, Budget Adjustments — about 18 fields total. Most organizations already track this data somewhere.
IT doesn’t want another app with its own login and its own security model.
Sign in with the Microsoft account your organization already uses, via Microsoft Entra ID. No new credentials, no new identity system.
You need to see the big picture and the one task that’s blowing the budget.
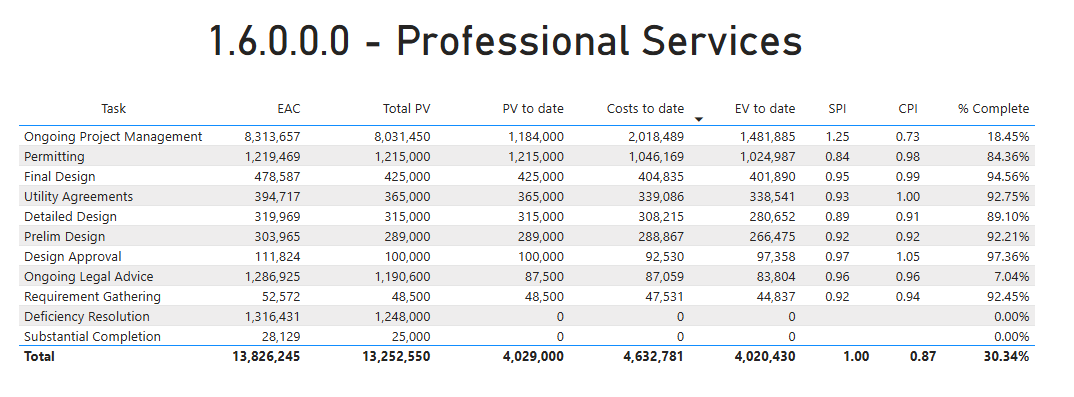
Drill from a portfolio-level view down through your WBS hierarchy to the individual work package driving the variance.
Key Features
Standardized EVM Reporting — SPI, CPI, budget variance, and more, calculated consistently across every project.
WBS Hierarchy Drill-Down — From portfolio view to individual work package.
AI-Generated Health Narratives — Plain-language project health summaries each period (select plans).
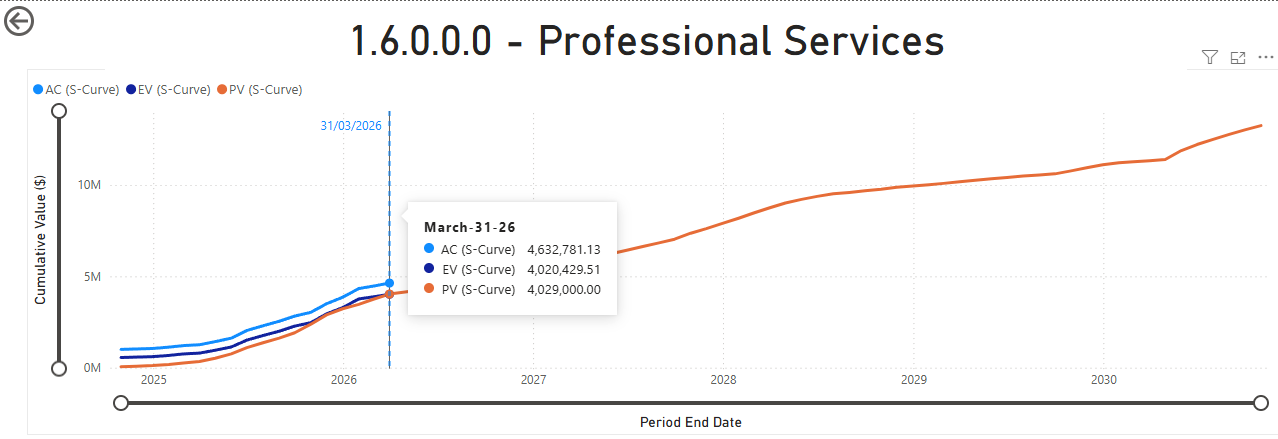
S-Curve Visualization — Track planned, earned, and actual cost over the life of the project.
Flexible Data Sources — Excel or CSV on every plan; direct SQL Server connection on Pro and above.
Secure by Design — Hosted on Microsoft Azure, secured with Microsoft Entra ID sign-in.
Role-Based Access — Administrators manage data and users; grant read-only access project by project.
Scales With Your Portfolio — Tiered plans grow with the size of your project portfolio.
How It Works
- Connect — Upload Excel/CSV files, or connect a SQL Server source, for each of PMBI’s six data tables.
- Map & Commit — Map your columns once, test the connection, and commit your reporting period snapshot.
- Report — Dashboards refresh automatically, often within minutes for select plans.
- Share — Executives sign in with their Microsoft account to view live, role-based dashboards anytime.
Not sure where to start? Check out our PMBI resource page to access our FAQ and User’s Guide.